 Web Server Statistics for rups.net Web Server Statistics for rups.net
(Go To: Top: General Summary: Daily Summary: Hourly Summary: Domain Report: Organization Report: Operating System Report: Status Code Report: File Size Report: File Type Report: Directory Report: Request Report)
This report contains overall statistics.
Successful requests: 12,555
Average successful requests per day: 12,562
Successful requests for pages: 11,142
Average successful requests for pages per day: 11,148
Failed requests: 3,124
Redirected requests: 2
Distinct files requested: 1,474
Distinct hosts served: 278
Data transferred: 1.69 gigabytes
Average data transferred per day: 1.70 gigabytes
(Go To: Top: General Summary: Daily Summary: Hourly Summary: Domain Report: Organization Report: Operating System Report: Status Code Report: File Size Report: File Type Report: Directory Report: Request Report)
This report lists the total activity for each day of the week, summed over all the weeks in the report.
Each unit ( ) represents 300 requests
for pages or part thereof.
) represents 300 requests
for pages or part thereof.
day: #reqs: #pages:
---: -----: ------:
Sun:     0:      0:
Mon:     0:      0:
Tue:     0:      0:
Wed:     0:      0:
Thu:     0:      0:
Fri:     0:      0:
Sat: 12555:  11142:
(Go To: Top: General Summary: Daily Summary: Hourly Summary: Domain Report: Organization Report: Operating System Report: Status Code Report: File Size Report: File Type Report: Directory Report: Request Report)
This report lists the total activity for each hour of the day, summed over all the days in the report.
Each unit () represents 25 requests
for pages or part thereof.
hour: #reqs: #pages: ----: -----: ------: 0: 477: 416:2: 470: 409:
23: 734: 702:
(Go To: Top: General Summary: Daily Summary: Hourly Summary: Domain Report: Organization Report: Operating System Report: Status Code Report: File Size Report: File Type Report: Directory Report: Request Report)
This report lists the countries of the computers which requested files.
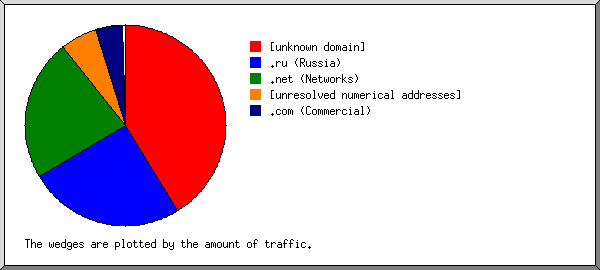
Listing domains, sorted by the amount of traffic.
#reqs: %bytes: domain
-----: ------: ------
 2091: 41.20%: [unknown domain]
 5161: 25.23%: .ru (Russia)
 1952: 22.86%: .net (Networks)
 1285:  5.87%: [unresolved numerical addresses]
 1003:  4.38%: .com (Commercial)
    5:  0.18%: .at (Austria)
  616:  0.12%: .de (Germany)
    2:  0.08%: .ua (Ukraine)
   65:  0.04%: [domain not given]
   46:  0.03%: .arpa (Arpanet)
    9:  0.01%: .ca (Canada)
    6:       : .co (Colombia)
    2:       : .bz (Belize)
    1:       : .vn (Vietnam)
    4:       : .gr (Greece)
    2:       : .ec (Ecuador)
    1:       : .br (Brazil)
    1:       : .es (Spain)
    1:       : .org (Non Profit Making Organizations)
  300:       : .ws (Samoa)
    2:       : .cz (Czech Republic)
(Go To: Top: General Summary: Daily Summary: Hourly Summary: Domain Report: Organization Report: Operating System Report: Status Code Report: File Size Report: File Type Report: Directory Report: Request Report)
This report lists the organizations of the computers which requested files.
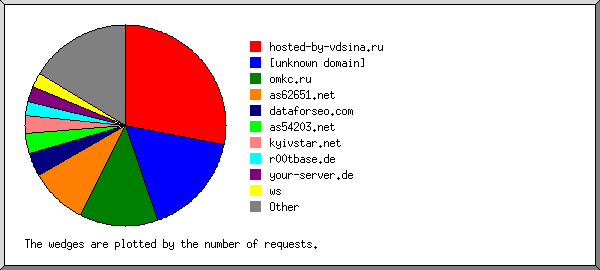
Listing the top 20 organizations by the number of requests, sorted by the number of requests.
#reqs: %bytes: organization
-----: ------: ------------
 3525: 24.31%: hosted-by-vdsina.ru
 2091: 41.20%: [unknown domain]
 1573:  0.89%: omkc.ru
 1158: 16.50%: as62651.net
  489:  0.31%: dataforseo.com
  411:  5.86%: as54203.net
  353:  0.20%: kyivstar.net
  300:  0.06%: r00tbase.de
  300:  0.06%: your-server.de
  300:       : ws
  276:  3.93%: 185.108
  189:  0.11%: 120
  150:  0.08%: 112
  106:  0.08%: ahrefs.com
   88:  0.05%: chinaunicom.com
   87:  0.04%: webmeup.com
   75:  0.04%: 174.138
   65:  0.04%: [domain not given]
   60:  3.45%: msn.com
   59:  0.58%: 5
  900:  2.23%: [not listed: 106 organizations]
(Go To: Top: General Summary: Daily Summary: Hourly Summary: Domain Report: Organization Report: Operating System Report: Status Code Report: File Size Report: File Type Report: Directory Report: Request Report)
This report lists the operating systems used by visitors.
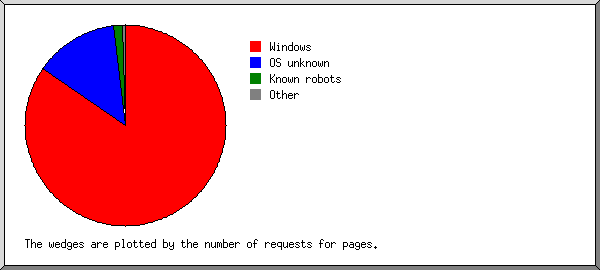
Listing operating systems, sorted by the number of requests for pages.
 #: #reqs: #pages: OS
--: -----: ------: --
 1: 10693:   9419: Windows
  :  5228:   4710:   Windows NT
  :  5398:   4643:   Unknown Windows
  :    67:     66:   Windows XP
 2:  1605:   1521: OS unknown
 3:   212:    161: Known robots
 4:    30:     26: Unix
  :    30:     26:   Linux
 5:    15:     15: Macintosh
(Go To: Top: General Summary: Daily Summary: Hourly Summary: Domain Report: Organization Report: Operating System Report: Status Code Report: File Size Report: File Type Report: Directory Report: Request Report)
This report lists the HTTP status codes of all requests.
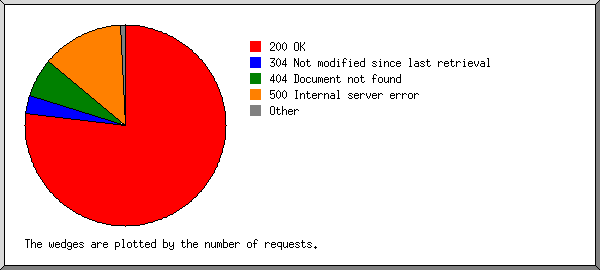
Listing status codes, sorted numerically.
#reqs: status code
-----: -----------
12058: 200 OK
   46: 206 Partial content
    2: 301 Document moved permanently
  451: 304 Not modified since last retrieval
   60: 403 Access forbidden
  983: 404 Document not found
 2081: 500 Internal server error
(Go To: Top: General Summary: Daily Summary: Hourly Summary: Domain Report: Organization Report: Operating System Report: Status Code Report: File Size Report: File Type Report: Directory Report: Request Report)
This report lists the sizes of files.
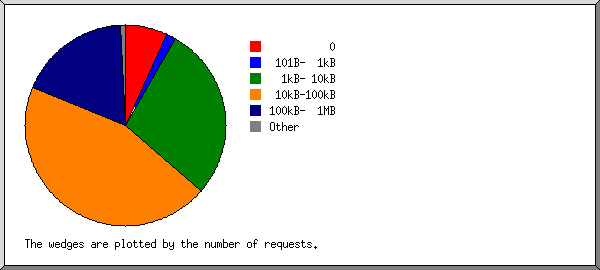
       size: #reqs: %bytes:
-----------: -----: ------:
          0:   865:       :
   1B-  10B:     0:       :
  11B- 100B:    60:       :
 101B-  1kB:   194:  0.01%:
  1kB- 10kB:  3515:  0.43%:
 10kB-100kB:  5604:  3.39%:
100kB-  1MB:  2295: 92.48%:
  1MB- 10MB:    21:  2.87%:
 10MB-100MB:     1:  0.82%:
(Go To: Top: General Summary: Daily Summary: Hourly Summary: Domain Report: Organization Report: Operating System Report: Status Code Report: File Size Report: File Type Report: Directory Report: Request Report)
This report lists the extensions of files.
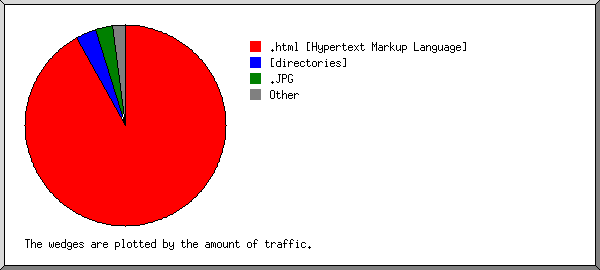
Listing extensions with at least 0.1% of the traffic, sorted by the amount of traffic.
#reqs: %bytes: extension
-----: ------: ---------
 3900: 91.99%: .html [Hypertext Markup Language]
 7213:  3.19%: [directories]
   24:  2.79%: .JPG
   20:  0.84%: .current
    1:  0.82%: .TIF
    1:  0.24%: .asf
 1318:  0.11%: .php  [PHP]
   78:  0.02%: [not listed: 8 extensions]
(Go To: Top: General Summary: Daily Summary: Hourly Summary: Domain Report: Organization Report: Operating System Report: Status Code Report: File Size Report: File Type Report: Directory Report: Request Report)
This report lists the directories from which files were requested. (The figures for each directory include all of its subdirectories.)
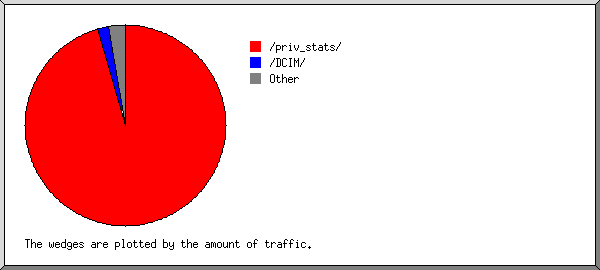
Listing directories with at least 0.01% of the traffic, sorted by the amount of traffic.
#reqs: %bytes: directory
-----: ------: ---------
 8008: 95.60%: /priv_stats/
   13:  1.76%: /DCIM/
    1:  0.82%: /megan/
    3:  0.41%: /120CANON/
    2:  0.30%: /photos/
    1:  0.24%: /music/
 2481:  0.22%: /blog/
 1127:  0.20%: /onlythegirls/
    2:  0.16%: /newphotos/
    3:  0.11%: /100OLYMP/
   56:  0.06%: /work/
    1:  0.05%: /katy/
   80:  0.05%: http://
   66:  0.01%: /girls/
  711:  0.03%: [not listed: 19 directories]
(Go To: Top: General Summary: Daily Summary: Hourly Summary: Domain Report: Organization Report: Operating System Report: Status Code Report: File Size Report: File Type Report: Directory Report: Request Report)
This report lists the files on the site.
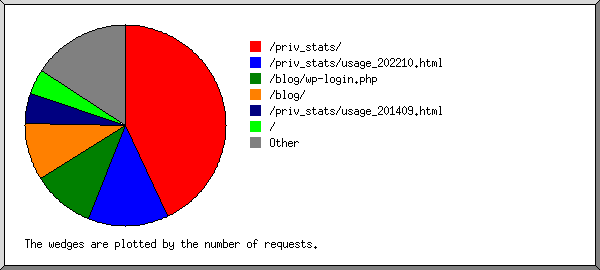
Listing files with at least 20 requests, sorted by the number of requests.
#reqs: %bytes:          last time: file
-----: ------: ------------------: ----
 5398:  3.04%: Oct/29/22 11:59 PM: /priv_stats/
 1628: 64.09%: Oct/29/22 11:59 PM: /priv_stats/usage_202210.html
 1256:  0.11%: Oct/29/22 11:59 PM: /blog/wp-login.php
 1168:  0.11%: Oct/29/22 11:59 PM: /blog/
  617: 26.22%: Oct/29/22 11:54 PM: /priv_stats/usage_201409.html
  499:       : Oct/29/22 11:49 PM: /
   80:  0.05%: Oct/29/22 11:55 PM: http://rups.net/priv_stats/
   61:  0.01%: Oct/29/22  5:03 PM: /oldphotos/index.php
   37:       : Oct/29/22  9:52 PM: /blog/wp-login.php/
   25:  0.06%: Oct/29/22  9:40 PM: /work/beta/ladd.html
   20:  0.84%: Oct/29/22  5:15 PM: /priv_stats/webalizer.current
 1766:  5.50%: Oct/29/22 11:58 PM: [not listed: 1,407 files]
(Go To: Top: General Summary: Daily Summary: Hourly Summary: Domain Report: Organization Report: Operating System Report: Status Code Report: File Size Report: File Type Report: Directory Report: Request Report)


